Accessing the Dashboards
To view a list of available Dashboards, click  and then click Dashboards from the drop-down menu.
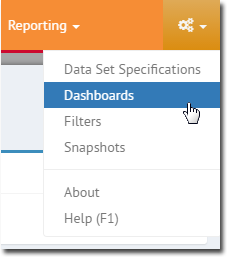
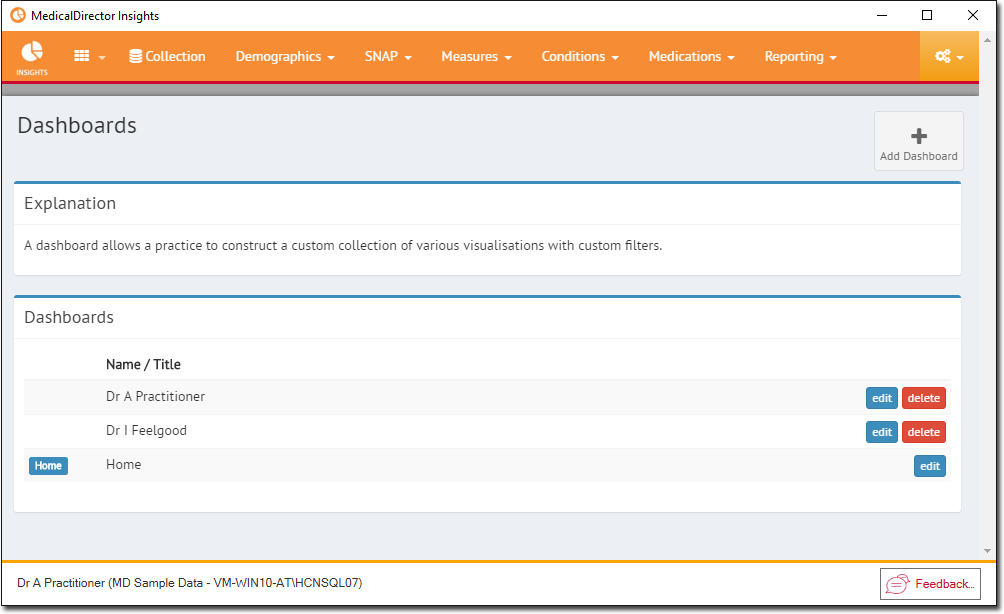
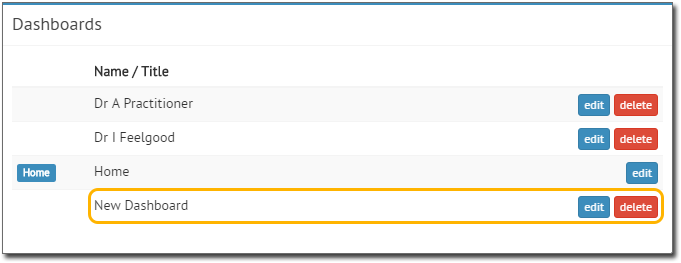
The Dashboards window appears, and you are presented with the list of available Dashboards. In our example, there are three Dashboards available;
o The Home Dashboard is the 'master' Dashboard, presented to you whenever you open Insights, or whenever you click  (located at the top-left of the window). You can edit this Dashboard is you wish.
o We have two custom Dashboards - one for each of two doctors at our practice. You can create as many Dashboards as you wish, and they are shared between users.
Creating Dashboards
Click 
A new Dashboard is created for you. The default name of New Dashboard can be replaced by clicking 
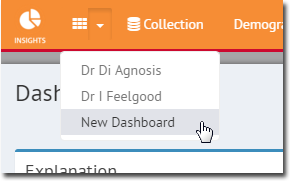
The new Dashboard is accessed via the button;
Add Widgets to a Dashboard
1. Via the button; select the Dashboard you wish to work on.
2. The Dashboard opens. If you are working on a new Dashboard you have just created, it will initially appear empty, as shown in our example below.
![]()
3. Click  to add a new Widget to the Dashboard.
![]()
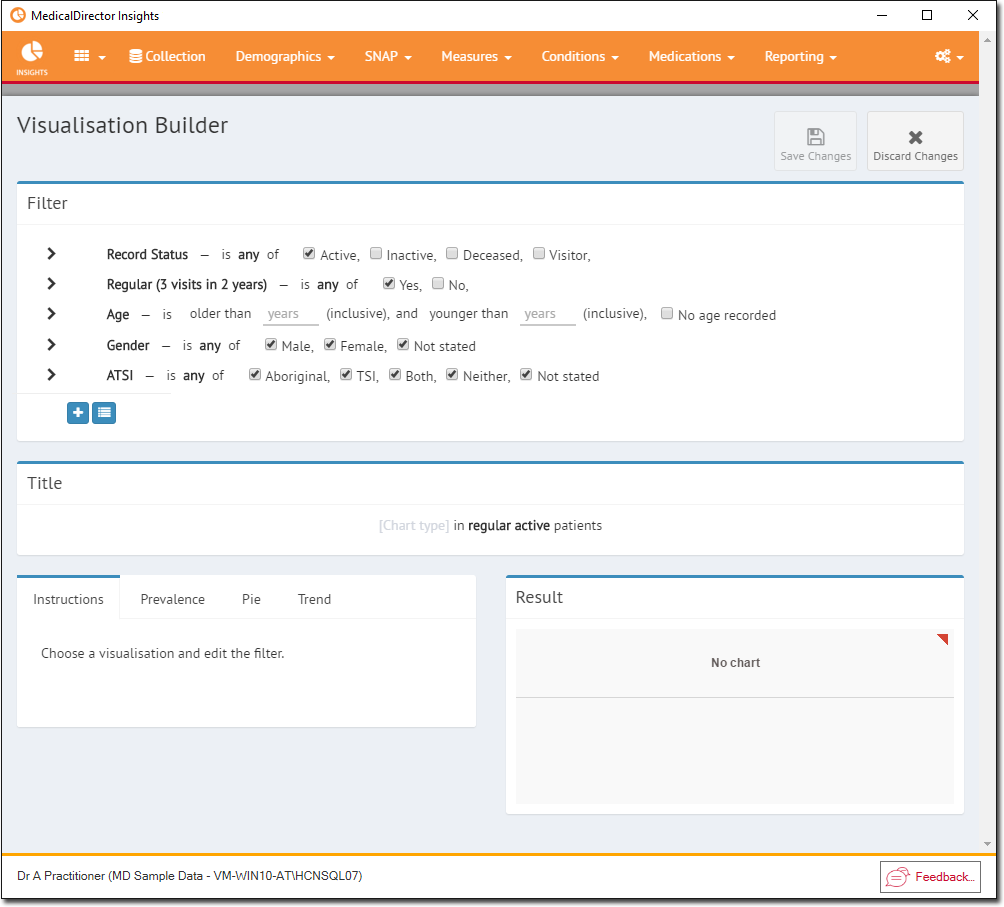
4. On the new Widget, locate and click  to activate the Visualisation Builder for this Widget. The Visualisation Builder allows you to specify the data set and appearance of the selected Widget.
o Filter section: Provides the standard filtering criteria. Please see Filtering Data for more information on how to use this panel.
o Title section: A title for this Widget is created dynamically, based on the filtering criteria you select.
o Instructions section: Where you specify how you want the data presented i.e. as a percentage/proportion/trend.
o Result section: Where the resulting data is displayed.
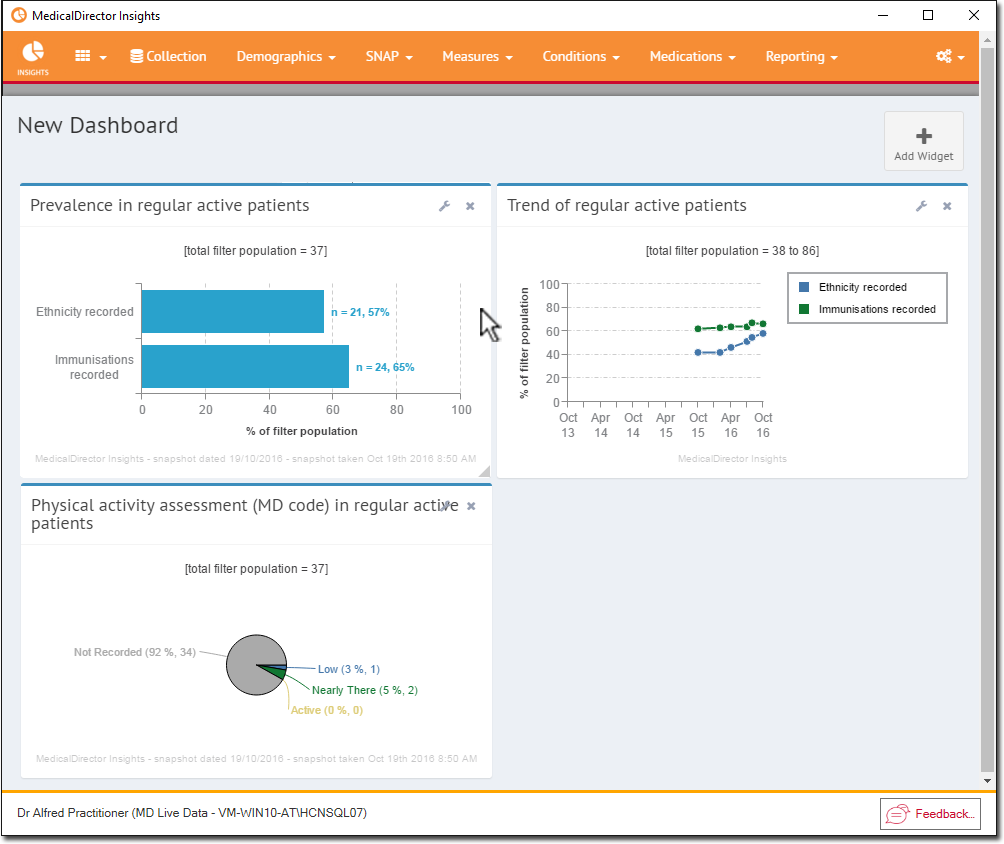
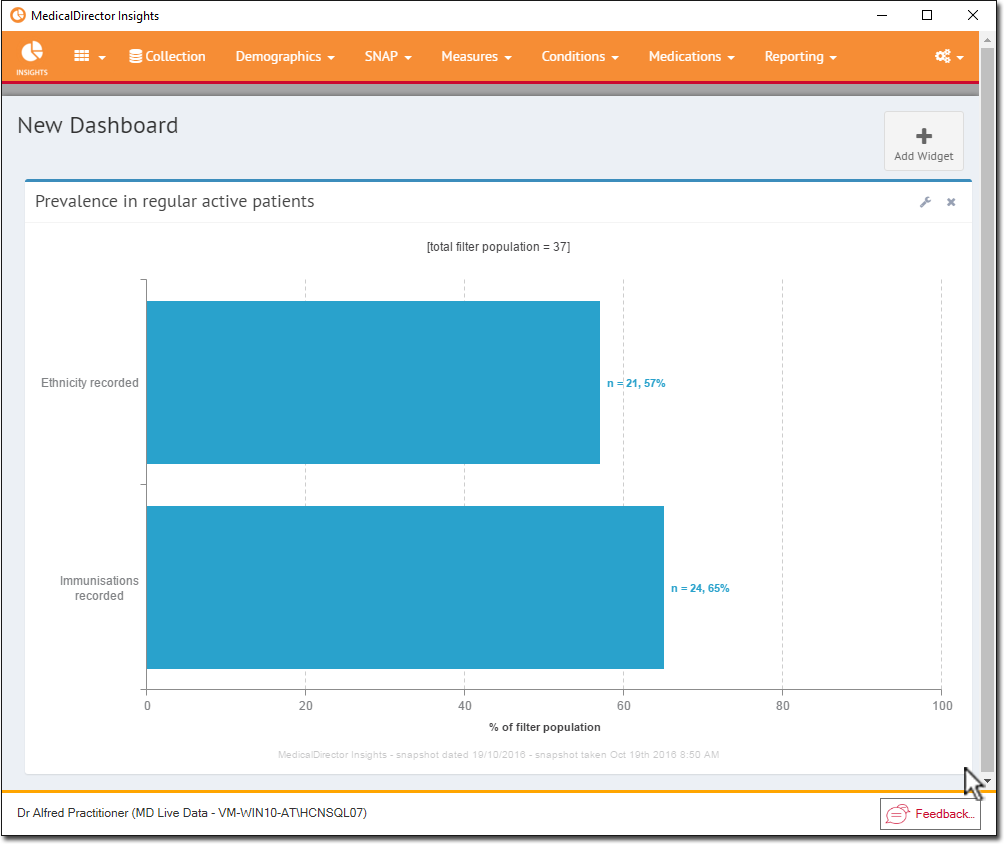
Choose a Visualisation - Prevalence
1. Select the Prevalence tab. Initially this tab will contain no data, as shown in our example below.
![]()
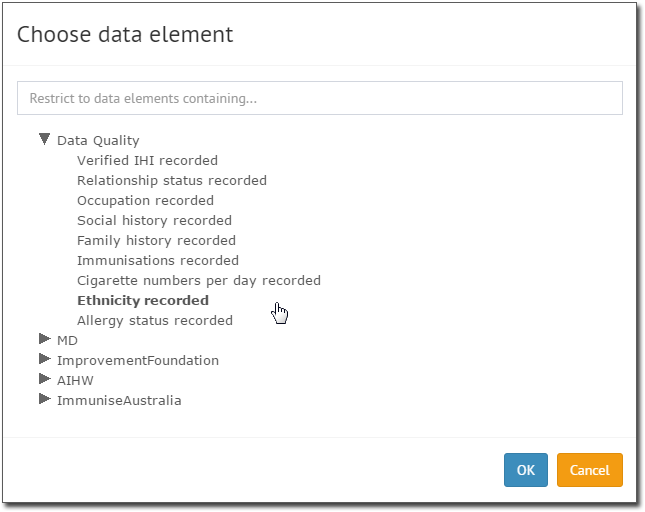
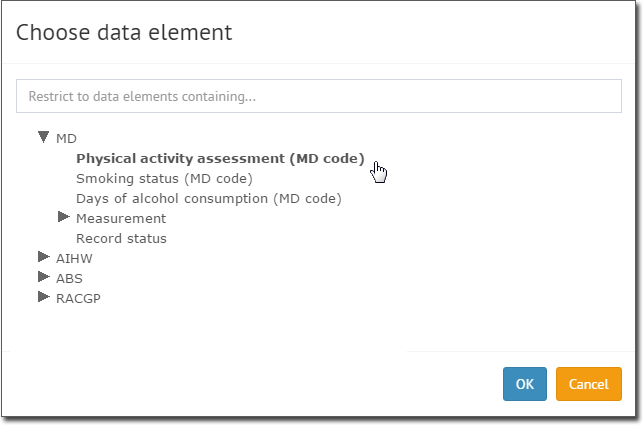
2. Click  to add a data element to examine. You will be prompted to select an element.
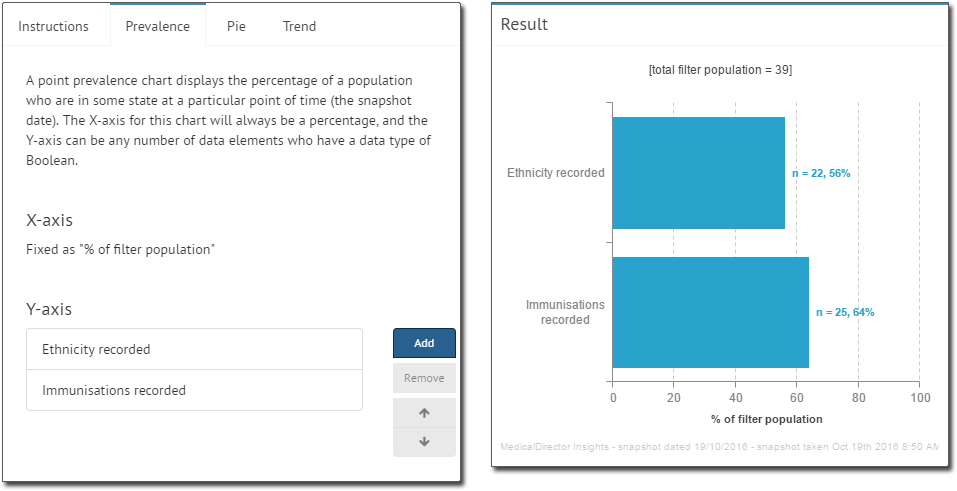
o Select an element. In our example, we selected Ethnicity recorded.
3. Click  You are returned to the Visualisation Builder, where the Result section now displays your data.
o You can add more data elements as desired. In our example, we've added 'Immunisations recorded'.
o You can remove a data element by selecting it, and clicking 
o Change the order in which elements are displayed by selecting one and clicking  or
or 
4. Ensure you click  to save the Widget before you close the Dashboard you are working on.
Choose a Visualisation - Pie
1. Select the Pie tab. Initially this tab will contain no data, as shown in our example below.
![]()
2. Click  to add a data element to examine. You will be prompted to select an element.
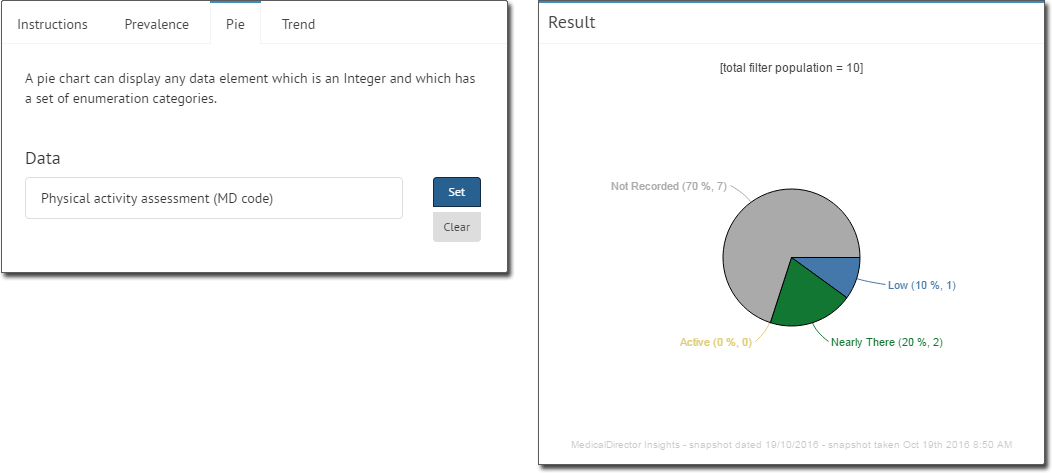
o Select an element. In our example, we selected Physical activity assessment (MD code).
3. Click You are returned to the Visualisation Builder, where the Result section now displays your data.
4. Ensure you click to save the Widget before you close the Dashboard you are working on.
Choose a Visualisation - Trend
1. Select the Trend tab. Initially this tab will contain no data, as shown in our example below.
![]()
2. Click to add a data element to examine. You will be prompted to select an element.
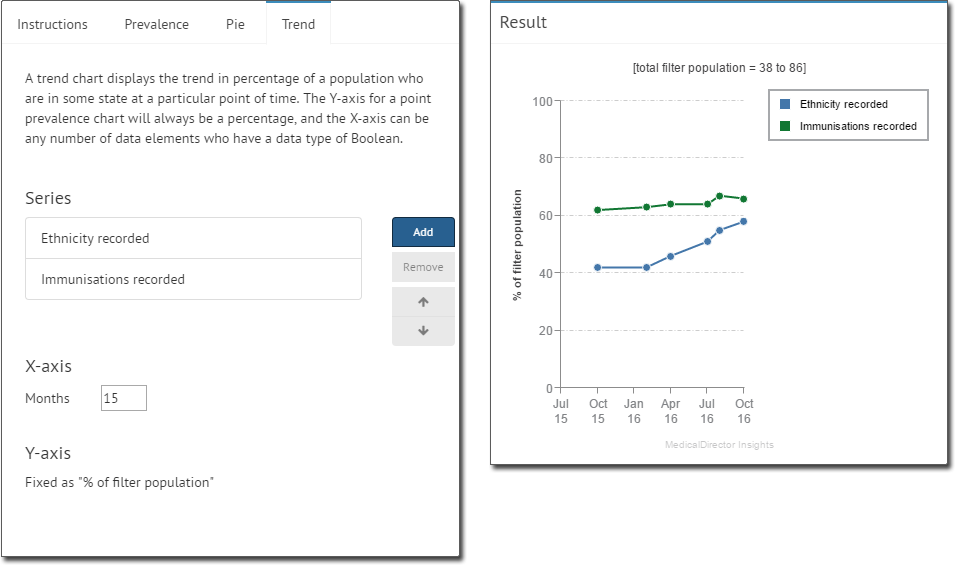
o Select an element. In our example, we selected Ethnicity recorded.
3. Click You are returned to the Visualisation Builder, where the Result section now displays your data.
o You can add more data elements as desired. In our example, we've added 'Immunisations recorded'.
o You can remove a data element by selecting it, and clicking
o Change the order in which elements are displayed by selecting one and clicking or
o Alter the X-axis time period by changing the value in the Months field.
4. Ensure you click to save the Widget before you close the Dashboard you are working on.